Imagine you’re tasked with understanding the shopping preferences of an entire city’s population. You could randomly survey people on the street, but what if your random sample accidentally includes mostly college students from one neighborhood? Your results would hardly represent the diverse mix of families, professionals, retirees, and other groups that make up the city’s true demographic landscape.
This challenge of accurately capturing insights from large, diverse populations is where stratified sampling becomes invaluable. Stratified sampling is a sophisticated research methodology that ensures every important segment of your target population gets proper representation in your study, leading to more accurate and actionable results.
Stratified Sampling: The Basics
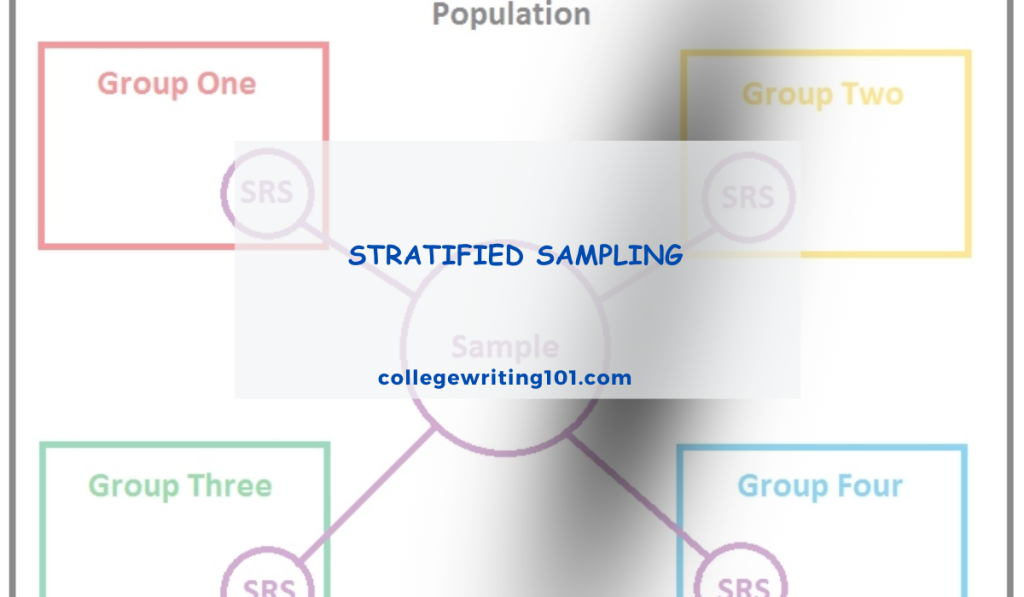
Stratified sampling is a probability sampling technique where researchers divide a population into distinct subgroups (called strata) based on shared characteristics, then randomly select samples from each subgroup. This method ensures that every segment of the population is represented proportionally in the final sample.
The key distinction between stratified sampling and simple random sampling lies in this deliberate organization. While simple random sampling treats the entire population as one homogeneous group, stratified sampling recognizes that populations often contain distinct subgroups that may behave or respond differently to the research question.
Key Terminology
To fully grasp stratified sampling, it’s essential to understand these fundamental terms:
Population: The entire group you want to study and draw conclusions about. This could be all customers of a company, all students in a school district, or all manufacturing units produced in a month.
Strata: The distinct subgroups within your population, created based on shared characteristics that are relevant to your research. Examples include age groups, income levels, geographic regions, or product categories.
Sampling Frame: The complete list of all members in your population from which you’ll select your sample participants.
Sample Size: The number of individuals selected from each stratum to participate in your study.
A Relatable Analogy
Think of stratified sampling like creating a perfectly balanced fruit salad. Instead of randomly grabbing fruit from a massive mixed bowl (which might give you all apples and no berries), you first separate the fruit into different bowls by type—apples, oranges, berries, and grapes. Then you take a proportional amount from each bowl to create a salad that truly represents the variety available. Your final fruit salad accurately reflects the diversity of all the fruit, just as a stratified sample accurately reflects the diversity of your research population.
This systematic approach ensures that minority groups aren’t accidentally underrepresented and that majority groups don’t dominate your results, giving you a clearer picture of the whole population’s characteristics and behaviors.
Types of Stratified Sampling
Stratified sampling comes in two primary forms, each designed to address different research objectives and population characteristics. Understanding when to use each type is crucial for maximizing the effectiveness of your research design.
Proportionate Stratified Sampling
Proportionate stratified sampling maintains the same ratio of subgroups in your sample as exists in the overall population. If 30% of your population consists of college graduates, then 30% of your sample will also be college graduates.
How It Works
The process is straightforward: first, determine what percentage each stratum represents in the total population. Then, apply these same percentages to your desired sample size. For example, if you’re studying consumer preferences in a city where 40% of residents are aged 25-40, 35% are aged 41-55, and 25% are over 55, your sample of 1,000 people would include 400 people aged 25-40, 350 people aged 41-55, and 250 people over 55.
When to Use Proportionate Stratified Sampling
This approach is ideal when:
- You want your sample to be a perfect miniature representation of the population
- All subgroups are large enough to provide meaningful data when sampled proportionally
- Your research question applies equally to all strata
- You’re conducting descriptive research to understand overall population characteristics
- Budget and time constraints require a straightforward sampling approach
Disproportionate Stratified Sampling
Disproportionate stratified sampling deliberately over-represents or under-represents certain strata based on research needs, analytical requirements, or practical considerations. This method doesn’t mirror the population’s natural proportions but instead adjusts sample sizes to meet specific research objectives.
How It Works
Researchers intentionally allocate different sampling rates to different strata. For instance, if you’re studying customer satisfaction across three service tiers where premium customers represent only 5% of the total customer base, you might sample 100 premium customers, 200 standard customers, and 100 basic customers, even though the population ratio is 5:70:25.
When to Use Disproportionate Stratified Sampling
This approach becomes necessary when:
- Some strata are too small to yield reliable results with proportionate sampling
- Certain subgroups are particularly important to your research objectives
- You need to make statistical comparisons between groups of different sizes
- Some strata show high variability and require larger samples for accurate measurement
- Cost considerations make it more expensive to sample from certain strata
- You’re conducting analytical research focused on relationships between variables within specific subgroups
Comparison of Both Types
| Aspect | Proportionate | Disproportionate |
|---|---|---|
| Population Representation | Exact mirror of population ratios | Adjusted ratios based on research needs |
| Complexity | Simpler to design and execute | More complex planning required |
| Statistical Analysis | Straightforward weighting | Requires careful weighting adjustments |
| Best for Small Groups | May undersample minority groups | Ensures adequate representation of all groups |
| Cost Efficiency | Generally more cost-effective | May be more expensive but provides better analytical power |
| Research Goals | Descriptive studies, general population insights | Comparative analysis, detailed subgroup examination |
The choice between proportionate and disproportionate stratified sampling ultimately depends on your research objectives, the characteristics of your population, and the level of detail you need from each subgroup. Many successful research projects combine elements of both approaches, using proportionate sampling for most strata while oversampling particularly important or rare subgroups.
The Step-by-Step Process
Implementing stratified sampling requires careful planning and systematic execution. Follow this detailed six-step process to ensure your stratified sampling design delivers reliable, actionable results.
Step 1: Define Your Target Population
Begin by clearly establishing the boundaries of your research population. This involves specifying exactly who or what should be included in your study and setting clear inclusion and exclusion criteria.
For a customer satisfaction survey, your target population might be “all customers who made a purchase in the last 12 months.” For a quality control study, it could be “all products manufactured at a specific facility during the third quarter.” The key is being specific enough that anyone could determine whether a particular individual or item belongs in your population.
Document demographic boundaries, geographic limitations, time frames, and any other relevant criteria that define your population. This clarity prevents scope creep and ensures your findings can be properly generalized.
Step 2: Identify Relevant Stratification Variables
Choose the characteristics you’ll use to divide your population into strata. These variables should be directly related to your research question and likely to influence the outcomes you’re measuring.
Effective stratification variables are typically:
- Easily measurable and verifiable (age, location, purchase history)
- Strongly related to your research topic (income levels for spending behavior studies)
- Relatively stable over time (education level, company size)
- Available in your sampling frame (information you can actually access)
Common stratification variables include demographics (age, gender, income), geographic factors (region, urban vs. rural), behavioral characteristics (usage frequency, loyalty status), and organizational factors (company size, industry type). Avoid using too many stratification variables simultaneously, as this creates an unwieldy number of small strata.
Step 3: Divide Population into Strata
Organize your population into mutually exclusive and collectively exhaustive strata. Each member of your population should belong to exactly one stratum, and every population member should fit into a stratum.
Create clear, non-overlapping boundaries for each stratum. Instead of vague categories like “young” and “middle-aged,” use specific ranges like “18-30 years” and “31-45 years.” This precision eliminates ambiguity and ensures consistent classification.
Aim for strata that are internally homogeneous (members within each stratum are similar to each other) but externally heterogeneous (different strata contain distinctly different types of population members). This maximizes the benefits of stratification by ensuring that differences between strata are meaningful.
Step 4: Determine Sample Size for Each Stratum
Calculate how many individuals you’ll sample from each stratum based on your chosen sampling approach (proportionate or disproportionate) and your overall sample size requirements.
For proportionate sampling, multiply your total desired sample size by each stratum’s percentage of the population:
- If Stratum A represents 40% of the population and you want 500 total samples, select 200 from Stratum A (500 × 0.40 = 200)
For disproportionate sampling, consider factors like:
- Variability within strata (more variable groups need larger samples)
- Importance of the stratum to your research objectives
- Cost of sampling from each stratum
- Minimum sample sizes needed for statistical analysis
Ensure each stratum has enough samples to provide meaningful results, typically at least 30 observations for statistical validity, though complex analyses may require larger minimums.
Step 5: Randomly Select Samples from Each Stratum
Within each stratum, use simple random sampling to select the predetermined number of participants. This maintains the probability-based nature of your sampling design and eliminates researcher bias in selection.
Use systematic approaches like:
- Random number generators to select from numbered lists
- Systematic sampling (selecting every nth member after a random start)
- Lottery methods for smaller strata
Maintain detailed records of your selection process, including any replacements needed for non-responses or invalid selections. This documentation supports the credibility of your methodology and helps with replication if needed.
Step 6: Combine Results for Analysis
When analyzing your stratified sample data, properly weight the results to account for different sampling rates across strata, especially in disproportionate sampling designs.
For proportionate sampling, analysis is straightforward since your sample mirrors the population structure. You can typically analyze the combined data directly.
For disproportionate sampling, apply weights that adjust each observation’s contribution to reflect its stratum’s true proportion in the population. If you oversampled a stratum that represents 10% of the population but comprises 25% of your sample, weight those observations by 0.4 (10%/25%) to restore proper representation.
Use statistical software capable of handling weighted data, and clearly document your weighting procedures. This ensures your final conclusions accurately represent the entire population rather than just your sample structure.
Advantages of Stratified Sampling
Stratified sampling offers numerous benefits that make it superior to simple random sampling in many research scenarios. Understanding these advantages helps you recognize when this method can significantly improve your research quality and efficiency.
Improved Accuracy and Precision
Stratified sampling typically produces more accurate estimates than simple random sampling because it reduces sampling variability. By ensuring representation across all important subgroups, you eliminate the risk of accidentally over-representing or under-representing key population segments.
The method’s precision comes from controlling the composition of your sample rather than leaving it to chance. This control means your sample statistics (like means and proportions) will be closer to the true population parameters, giving you more confidence in your findings and requiring smaller sample sizes to achieve the same level of accuracy.
Better Representation of Subgroups
One of stratified sampling’s greatest strengths is guaranteeing that all relevant population subgroups appear in your sample in meaningful numbers. This is particularly valuable when studying diverse populations where some groups might be minorities but are still important to your research objectives.
For example, if you’re studying employee satisfaction across a company with multiple departments, stratified sampling ensures that smaller departments like legal or R&D aren’t completely missed or severely underrepresented. This comprehensive representation allows you to understand the experiences of all employee groups, not just the largest departments.
Reduced Sampling Error
Stratified sampling systematically reduces sampling error by eliminating between-stratum variance from your error calculations. Since you’re sampling from more homogeneous groups within each stratum, the variability in your estimates decreases compared to sampling from the entire heterogeneous population at once.
This error reduction is most pronounced when the stratification variable is strongly correlated with your outcome variables. If income level strongly predicts spending behavior, stratifying by income will substantially reduce the error in your spending estimates compared to simple random sampling.
Cost-Effectiveness for Certain Research Goals
While stratified sampling requires more upfront planning, it often proves more cost-effective than alternatives for achieving specific research objectives. The method allows you to allocate your sampling budget more efficiently by adjusting sample sizes based on the importance and variability of different strata.
You can reduce costs by sampling less from expensive-to-reach populations while ensuring adequate representation, or by sampling more heavily from high-variability groups that need larger samples for reliable estimates. This targeted approach often delivers better results per dollar spent than simple random sampling.
Enhanced Statistical Power
Stratified sampling increases your study’s statistical power—the ability to detect true differences or relationships when they exist. By reducing error variance and ensuring adequate representation of all relevant groups, you’re more likely to identify significant patterns and relationships in your data.
This enhanced power is particularly valuable in comparative studies where you’re looking for differences between groups. With proper stratification, you’ll have sufficient sample sizes in each comparison group and reduced background noise, making it easier to detect meaningful differences.
Disadvantages and Limitations
Despite its many advantages, stratified sampling isn’t always the best choice for every research situation. Understanding its limitations helps you make informed decisions about when to use this method and how to address potential challenges.
Increased Complexity in Design and Execution
Stratified sampling requires significantly more planning and coordination than simple random sampling. You must identify appropriate stratification variables, obtain detailed population information, create sampling frames for each stratum, and manage multiple sampling processes simultaneously.
This complexity extends to data collection and analysis phases. Field teams may need training on different protocols for different strata, and data analysis requires careful attention to weighting and stratum-specific considerations. The additional complexity increases the chances for errors and requires more experienced researchers to execute properly.
Requires Prior Knowledge of Population Characteristics
Effective stratification depends on having detailed, accurate information about your population’s composition before sampling begins. You need to know how the population breaks down across your chosen stratification variables, which may require preliminary research or access to comprehensive databases.
This requirement can be problematic when studying new or rapidly changing populations, or when relevant population data is unavailable, outdated, or unreliable. Without accurate population information, your stratification may be based on incorrect assumptions, undermining the method’s benefits.
Potential for Classification Errors
Incorrectly classifying population members into the wrong strata can bias your results and reduce the effectiveness of stratification. These errors might occur due to outdated information, measurement errors, or ambiguous classification criteria.
For example, if you’re stratifying by income level but using tax records from two years ago, recent job changes or economic shifts might mean some individuals are classified into the wrong income stratum. Such misclassification reduces the homogeneity within strata and can introduce bias into your estimates.
Higher Administrative Costs
The additional planning, coordination, and execution requirements of stratified sampling typically result in higher administrative costs compared to simple random sampling. You may need specialized software, additional staff training, more complex data management systems, and longer project timelines.
These costs can be particularly significant for organizations conducting research infrequently or those with limited research infrastructure. The administrative burden may outweigh the benefits for simple research questions or when high precision isn’t critical.
Time-Intensive Preparation Phase
Stratified sampling requires extensive preparation before data collection can begin. This includes population analysis, stratification variable selection, sampling frame development, sample size calculations for each stratum, and coordination of multiple sampling processes.
The preparation phase can add weeks or months to your project timeline, which may be problematic for time-sensitive research or when quick results are needed for decision-making. The extended timeline also increases the risk that population characteristics might change between planning and execution phases.
Real-World Applications and Examples
Stratified sampling proves invaluable across diverse industries and research contexts. These practical examples demonstrate how organizations successfully apply this methodology to gather more reliable insights and make better-informed decisions.
Market Research: Consumer Behavior Across Demographics
A major retail chain wanted to understand shopping preferences across their customer base to optimize their product mix and marketing strategies. Using simple random sampling would risk over-representing their largest customer segment (middle-aged suburban families) while potentially missing insights from younger urban customers and older rural customers who shop differently but represent significant revenue opportunities.
The company stratified their customer database by three key variables: age group (18-30, 31-50, 51+), location type (urban, suburban, rural), and spending tier (low, medium, high spenders). This created a manageable number of strata that captured the most important variations in shopping behavior.
By using disproportionate stratified sampling, they ensured adequate representation of smaller but strategically important segments like high-spending urban millennials and rural seniors. The results revealed distinct preferences across segments that led to targeted product lines and location-specific marketing campaigns, ultimately increasing sales by 15% in the following year.
Medical Studies: Clinical Trials with Diverse Patient Groups
Pharmaceutical companies conducting clinical trials must ensure their results apply to the diverse populations who will eventually use their medications. A company testing a new blood pressure medication needed to understand how it performed across different demographic groups, as medication effectiveness can vary significantly by age, gender, ethnicity, and existing health conditions.
The researchers stratified their participant pool by age (under 40, 40-60, over 60), gender, ethnicity (White, Black, Hispanic, Asian, Other), and severity of hypertension (mild, moderate, severe). This stratification was crucial because previous research showed that blood pressure medications often work differently across these groups.
Using proportionate stratified sampling based on the demographics of hypertension patients in the general population, they ensured their trial results would be generalizable to the broader patient population. The study revealed that the medication was particularly effective in older Hispanic women but showed reduced effectiveness in younger Black men, leading to dosage adjustments and targeted prescribing guidelines.
Educational Research: Student Performance Across Different Schools
A state education department wanted to evaluate the effectiveness of a new mathematics curriculum implemented across their school districts. Simple random sampling of students might have inadvertently focused on schools from affluent districts while missing students from under-resourced schools, leading to skewed results that wouldn’t represent the full range of implementation challenges.
The researchers stratified schools by district funding level (high, medium, low), school size (small, medium, large), and urban/rural classification. Within each stratum, they randomly selected schools and then randomly selected students within those schools for testing.
This approach revealed that the new curriculum was highly effective in well-funded urban schools but struggled in under-resourced rural schools due to limited technology access and teacher training. These insights led to targeted support programs and curriculum modifications that improved outcomes across all school types.
Political Polling: Voter Preferences by Region and Demographics
During election season, polling organizations must accurately predict voting patterns across diverse constituencies. A national polling firm conducting pre-election surveys needed to ensure their sample reflected the actual composition of likely voters rather than just the easiest people to reach by phone.
They stratified their sampling by state, age group, education level, and voting history (frequent voters, occasional voters, new voters). This stratification was essential because voting patterns vary dramatically across these dimensions, and simple random sampling might over-represent certain groups like older, more politically engaged voters who are more likely to answer polling calls.
Using disproportionate stratified sampling, they oversampled key swing states and underrepresented demographics to ensure reliable estimates for all groups that would influence the election outcome. Their stratified approach produced predictions within 2% of actual election results, compared to 5-7% errors from competitors using less sophisticated sampling methods.
Quality Control: Manufacturing Processes Across Different Shifts
A manufacturing company producing automotive parts needed to monitor quality across their 24/7 production schedule. They suspected that quality varied by shift due to differences in staffing, equipment maintenance schedules, and supervisor experience, but simple random sampling of parts might miss shift-specific patterns.
The company stratified their sampling by production shift (day, evening, night), production line (A, B, C), and day of the week (Monday-Friday vs. weekend). This stratification captured the key operational variables that could influence product quality.
Using proportionate stratified sampling, they discovered that the night shift consistently produced parts with slightly higher defect rates, weekend production showed increased variability, and Line B had systematic calibration issues. These insights led to targeted interventions including additional night shift training, improved weekend supervision, and equipment maintenance scheduling that reduced overall defect rates by 30%.
Stratified vs. Other Sampling Methods
Understanding when to choose stratified sampling over alternative methods requires comparing its strengths and limitations with other popular sampling approaches. Each method serves different research needs and operational constraints.
Comparison with Simple Random Sampling
Simple random sampling treats the entire population as one homogeneous group and selects participants with equal probability, regardless of their characteristics.
Key Differences:
- Representation: Simple random sampling may accidentally under-represent or miss important subgroups, while stratified sampling guarantees representation of all relevant segments
- Precision: Stratified sampling typically produces more precise estimates with smaller confidence intervals
- Complexity: Simple random sampling is much easier to design and execute
- Cost: Simple random sampling usually costs less upfront but may require larger sample sizes to achieve the same precision
When to Choose Simple Random Sampling:
- Your population is relatively homogeneous
- You have limited information about population characteristics
- Speed and simplicity are priorities
- Budget constraints are severe
- The research question doesn’t require detailed subgroup analysis
When to Choose Stratified Sampling:
- Your population contains distinct, important subgroups
- You need reliable estimates for specific segments
- Precision is more important than simplicity
- You have good information about population structure
Differences from Cluster Sampling
Cluster sampling divides the population into groups (clusters), randomly selects some clusters, then studies all members within selected clusters.
Key Differences:
- Group composition: Stratified sampling uses homogeneous strata and samples from all strata, while cluster sampling uses heterogeneous clusters and samples only some clusters
- Geographic efficiency: Cluster sampling is more efficient when the population is geographically dispersed
- Precision: Stratified sampling usually provides better precision, while cluster sampling may have higher sampling error
- Cost structure: Cluster sampling reduces travel and administrative costs, while stratified sampling may increase them
Example distinction: To study student performance, stratified sampling might group students by grade level and sample from each grade, while cluster sampling might randomly select entire schools and study all students in those schools.
Contrast with Systematic Sampling
Systematic sampling selects every nth member from a ordered list after a random starting point.
Key Differences:
- List requirements: Systematic sampling needs a complete, ordered list of the population, while stratified sampling needs population characteristics information
- Periodicity risk: Systematic sampling can introduce bias if the list has hidden patterns, while stratified sampling avoids this issue
- Subgroup control: Stratified sampling guarantees subgroup representation, while systematic sampling leaves it to chance
- Implementation: Systematic sampling is simpler to execute in the field
When systematic sampling works well:
- You have a good quality, randomly ordered population list
- The population doesn’t have systematic patterns that align with your sampling interval
- You need a simple, efficient sampling process
- Detailed subgroup analysis isn’t required
When to Choose Stratified Sampling Over Alternatives
Stratified sampling becomes the preferred choice when:
Population diversity matters most: Your research question specifically requires understanding different population segments, and missing or under-representing any segment would compromise your conclusions.
Precision is paramount: You need the most accurate estimates possible and are willing to invest in more complex methodology to achieve higher precision.
Subgroup analysis is essential: Your research plan includes comparing results across different population segments or reporting findings separately for each group.
Known population structure exists: You have reliable, detailed information about how your population breaks down across relevant characteristics.
Quality over speed: You can afford longer planning phases and more complex execution in exchange for higher-quality results.
Resource optimization is needed: You want to allocate your sampling budget most efficiently by adjusting sample sizes based on subgroup importance and variability.
The decision often comes down to balancing research quality needs against practical constraints of time, budget, and complexity tolerance. Stratified sampling excels when the research stakes are high and the additional effort investment can be justified by significantly better results.
Best Practices and Tips
Successful stratified sampling requires attention to numerous methodological details that can make the difference between excellent results and wasted effort. These proven practices help you avoid common pitfalls and maximize the benefits of your stratified sampling design.
How to Choose Appropriate Stratification Variables
Selecting the right variables to create your strata is perhaps the most critical decision in stratified sampling design. The quality of your stratification variables directly impacts the effectiveness of your entire study.
Focus on variables strongly related to your research question. If you’re studying customer satisfaction, variables like service tier, purchase frequency, or complaint history are likely more relevant than demographic characteristics. The stronger the relationship between your stratification variable and outcome variables, the greater the precision benefits you’ll achieve.
Prioritize variables with known, reliable population distributions. You need accurate information about how your population breaks down across each stratification variable. Variables measured in recent, comprehensive databases or surveys work better than those requiring estimation or outdated information.
Choose variables that are relatively stable over time. Avoid stratifying by characteristics that change frequently, as your population structure might shift between planning and data collection phases. Age, education level, and geographic location tend to be more stable than income, job status, or health conditions.
Limit the number of stratification variables to maintain manageable strata sizes. Each additional variable multiplies the number of strata exponentially. Using three binary variables creates eight strata, while adding a fourth creates sixteen. More strata mean smaller subgroups and potential difficulties achieving adequate sample sizes.
Ensure variables can be measured accurately and consistently. Avoid subjective or ambiguous classifications that might lead to inconsistent assignment of population members to strata. Clear, objective criteria reduce classification errors and improve the reliability of your stratification.
Determining Optimal Stratum Sizes
Calculating appropriate sample sizes for each stratum requires balancing statistical requirements, practical constraints, and research objectives.
Start with minimum statistical requirements. Each stratum needs enough observations to produce meaningful results. For basic descriptive statistics, aim for at least 30 observations per stratum. Complex analyses like regression modeling may require 50-100 observations or more, depending on the number of variables you plan to examine.
Consider the variability within each stratum. More variable strata need larger sample sizes to achieve the same precision level. If you have preliminary data or pilot study results indicating different levels of variability across strata, allocate samples accordingly.
Account for expected response rates. If historically certain strata have lower response rates, plan larger initial samples to compensate. Business executives might have 20% response rates while students might have 70%, requiring different initial sample size calculations.
Use optimal allocation formulas when precision is critical. The Neyman allocation method determines optimal sample sizes by considering both stratum size and variability, minimizing the overall sampling error for a given total sample size. This approach works well when you have good estimates of within-stratum variance.
Balance statistical needs with practical constraints. Sometimes optimal statistical allocation isn’t feasible due to budget limitations, availability of participants, or other practical considerations. Document these constraints and their potential impact on your results.
Common Mistakes to Avoid
Learning from typical stratified sampling errors can save you significant time and improve your research quality.
Don’t create too many strata with insufficient sample sizes. Over-stratification leads to strata with only a few observations each, reducing statistical power and making meaningful analysis impossible. It’s better to have fewer, well-populated strata than many tiny ones.
Avoid using outdated population information for stratification. Population characteristics change over time, and stratification based on old data can create systematic bias. Verify that your population information is current and representative.
Don’t ignore non-response patterns across strata. If certain strata consistently have lower response rates, your final sample may not reflect your intended stratification design. Plan for differential response rates and have strategies to address them.
Resist the temptation to change strata definitions during data collection. Mid-study changes to stratification criteria can introduce bias and make it difficult to weight results properly. Commit to your stratification scheme before beginning data collection.
Don’t forget to properly weight results in analysis. Particularly in disproportionate stratified sampling, failing to apply appropriate weights can lead to biased conclusions. Ensure your analysis software and procedures account for your sampling design.
Avoid assuming that more stratification variables are always better. Additional stratification variables increase complexity without necessarily improving results. Focus on the variables most relevant to your research questions rather than including everything available.
Tools and Software Recommendations
Modern technology can significantly streamline the stratified sampling process and reduce the likelihood of errors.
Statistical Software Packages:
- R: Offers excellent packages like ‘sampling’ and ‘survey’ for stratified sampling design and analysis, with powerful weighting capabilities
- SPSS: Provides user-friendly interfaces for complex sampling designs through its Complex Samples module
- SAS: Includes comprehensive procedures (PROC SURVEYSELECT, PROC SURVEYMEANS) specifically designed for stratified sampling
- Stata: Features robust survey analysis capabilities with straightforward syntax for stratified designs
Sample Size Calculation Tools:
- G*Power: Free software for calculating required sample sizes across different strata
- nQuery: Professional software with advanced sample size calculations for complex designs
- Online calculators: Various web-based tools for basic stratified sampling calculations, though professional software is recommended for complex studies
Data Management Recommendations:
- Use spreadsheet templates or database systems to track stratum assignments and sampling progress
- Implement quality control checks to verify proper classification of population members
- Maintain detailed documentation of all sampling decisions and procedures
- Create backup systems for critical sampling frames and population data
Field Management Tools:
- Survey platforms like Qualtrics or SurveyMonkey that can manage quota sampling within strata
- Customer relationship management (CRM) systems that can segment populations and track contact attempts
- Project management software to coordinate sampling activities across multiple strata and research team members
The key is choosing tools that match your technical expertise, budget constraints, and study complexity while ensuring you can properly implement and analyze your stratified sampling design.
FAQs
What is the main purpose of stratified sampling?
The main purpose of stratified sampling is to make sure all important subgroups (called strata) in a population are fairly represented in the sample. This helps improve the accuracy of the results and reduces the chances of bias.
When should I use stratified sampling?
Stratified sampling is best used when your population has different groups with unique characteristics, and you want to make sure each group is included. For example, if you are surveying students in a school and want to include students from every grade level, stratified sampling would be a good choice.
What is the difference between stratified sampling and simple random sampling?
In simple random sampling, everyone in the population has an equal chance of being chosen, but it might not include all groups fairly. In stratified sampling, the population is divided into groups first, and then random samples are taken from each group. This helps make sure every subgroup is represented in the final sample.