Have you ever heard the strange fact that ice cream sales are linked to a rise in crime? It’s a true statistical link. As scoops sold go up, so does the crime rate. But does this mean your sweet tooth is turning you into a criminal, or that a sudden urge to break the law is always preceded by a craving for rocky road? Of course not. This puzzling connection is the perfect entry point into the fascinating and often misunderstood world of correlational research.
Correlational research is a method used to see if two or more things—what researchers call “variables”—are connected in some way. It’s about identifying patterns in the world around us. This type of research excels at telling us the strength and direction of a relationship. What it absolutely cannot do, however, is prove that one variable causes the other to change.
This leads us to the golden rule you will see throughout this article: Correlation does not equal causation. To understand why this is one of the most important concepts in science and daily life, we’ll explore what correlation really is, look at clear examples, and unpack the common traps our brains fall into when we see two things happening together.
Types of Correlation
Positive Correlation (As One Goes Up, the Other Goes Up)
This is the most straightforward type of relationship. A positive correlation means that when there is an increase in one variable, there tends to be an increase in the other. Likewise, as one variable decreases, the other tends to decrease. They move in the same direction.
- Simple Example: Think about the relationship between the number of hours you study and your test score. Generally, the more time you spend studying, the higher your test score will be. If you were to plot this on a graph, the data points would trend upward from left to right.
Negative Correlation (As One Goes Up, the Other Goes Down)
A negative correlation (also called an inverse correlation) is the opposite. When there is an increase in one variable, there tends to be a decrease in the other. They move in opposite directions.
- Simple Example: Consider the relationship between the number of hours you play video games on a school night and your grade point average (GPA). A researcher might find that the more hours a student spends gaming, the lower their GPA tends to be. On a graph, these data points would trend downward from left to right.
Zero Correlation (No Relationship)
As the name suggests, this is when there is no discernible connection between two variables. An increase or decrease in one has no bearing on the other. Their changes are completely random and unrelated.
- Simple Example: There is no relationship between a person’s shoe size and their IQ score. A person with a size 13 shoe is just as likely to have a high IQ as a person with a size 6 shoe. Plotting this data would result in a random scatter of points with no clear pattern.
The Causation Trap: Why We Get It Wrong
Our brains are pattern-matching machines. When we see two events happening together, our instinct is to assume one caused the other. This mental shortcut is often helpful, but in research, it can lead us to completely wrong conclusions. This is the “causation trap,” and it’s primarily caused by two major issues.
The Third Variable Problem
This is the most common reason a correlation is misinterpreted. The third variable problem occurs when an unmeasured “third variable” may be secretly pulling the strings, causing both of the variables you’re observing to change simultaneously.
- Let’s Solve the Ice Cream Riddle: Remember the correlation between ice cream sales and crime? Neither one causes the other. The hidden third variable is hot weather.
- When the weather is hot, more people buy ice cream.
- When the weather is hot, more people are outside, windows are open, and social interactions (both positive and negative) increase, leading to a rise in opportunistic crimes.
- The heat—our third variable—is the real cause behind the increase in both ice cream sales and crime. The two are correlated, but there is no causal link between them.
The Directionality Problem
This is a classic “chicken-or-the-egg” dilemma. Sometimes, two variables are indeed causally linked, but correlational research cannot tell us which one is the cause and which is the effect.
- Example from Psychology: Researchers have consistently found a strong positive correlation between low self-esteem and depression. It’s a real and important connection. But what is the direction of this relationship?
- Does having low self-esteem cause a person to become depressed?
- Or does being depressed cause a person’s self-esteem to plummet?
Without a controlled experiment, it’s impossible to say. The relationship could even be a vicious cycle, where each variable influences the other. Correlational data can only show us the “what” (they are linked), not the “how” or “why.”
Correlational Research Examples in Action
A. Example in Health & Medicine
- Field: Health & Medicine
- Variables:
- Variable A: Amount of weekly physical exercise (measured in hours).
- Variable B: Systolic blood pressure (the top number in a blood pressure reading).
- Finding & Type of Correlation: Medical researchers consistently find a strong negative correlation between these two variables. As the number of hours spent exercising each week increases, a person’s average systolic blood pressure tends to decrease.
- Interpretation: In simple terms, the data shows that people who exercise more frequently are more likely to have blood pressure in a healthy range. This finding is incredibly useful for public health recommendations, as it suggests a link between a manageable lifestyle habit (exercise) and a key indicator of cardiovascular health (blood pressure).
- The Causation Trap: This correlation seems like obvious cause-and-effect, and a wealth of other experimental research does support that exercise causes blood pressure to lower. However, if we were to look at this correlational study in isolation, we couldn’t make that claim definitively. Why? We must consider the third variable problem.What if another factor is responsible for both?
- Health Consciousness: A person who is dedicated enough to exercise five hours a week might also be more health-conscious in other ways. They might also eat a low-sodium diet, avoid smoking, manage their stress, and get enough sleep. This overall healthy lifestyle—not just the exercise alone—could be the primary driver behind their lower blood pressure.
- Access to Resources: People with the time and money for gym memberships or safe places to run might also have better access to quality healthcare and healthier food options, which independently influence blood pressure.
B. Example in Psychology
- Field: Psychology
- Variables:
- Variable A: Time spent on social media per day (measured in hours).
- Variable B: Reported feelings of loneliness (measured on a survey scale).
- Finding & Type of Correlation: Numerous studies have found a consistent positive correlation between these variables. In other words, as the amount of time people spend on platforms like Instagram, Facebook, and TikTok increases, their reported feelings of loneliness also tend to increase.
- Interpretation: This finding suggests a troubling link between heavy social media use and social isolation. It has fueled a global conversation about the nature of online “connection” and its real-world impact on mental well-being, especially among young people.
- The Causation Trap: This is a classic example of the directionality problem. The data clearly shows a connection, but the “why” is extremely difficult to determine from correlation alone. We are left with a critical “chicken-or-the-egg” question:
- Does social media use cause loneliness? One hypothesis is that constantly viewing the curated, highlight-reel versions of others’ lives leads to social comparison, envy, and a feeling of being left out. Another is that time spent online simply replaces the more fulfilling face-to-face interactions that are crucial for genuine connection.
- Or, do lonely people turn to social media? It is equally plausible that individuals who already feel lonely or socially anxious use social media as a lower-stakes way to seek connection and fill a social void. In this scenario, loneliness is the cause, and heavy social media use is the effect.
- Correlational research can’t untangle this complex web; it can only sound the alarm that a relationship exists and that it warrants a deeper, more experimental investigation.
C. Example in Education
- Field: Education
- Variables:
- Variable A: A student’s class attendance rate (recorded as a percentage).
- Variable B: The student’s final grade in that same class (recorded as a percentage).
- Finding & Type of Correlation: In the field of education, this is one of the most reliable findings: there is a strong positive correlation between attendance and grades. Students with higher attendance rates almost always achieve higher final grades, and vice-versa.
- Interpretation: The data strongly suggests that being present in the classroom is a critical component of academic success. School administrators and teachers use this data to justify and enforce attendance policies, arguing that simply showing up gives students the best chance to succeed.
- The Causation Trap: While the conclusion seems obvious—attending class helps you learn, which improves your grade—a careful researcher must still consider potential third variables.
- Student Motivation: Imagine a highly motivated student. This student is more likely to do two things: attend every class and spend the necessary time studying, completing homework, and preparing for exams. Is it just their physical presence in the room that leads to the “A,” or is it their underlying motivation that drives both their attendance and their other successful academic behaviors?
- Life Circumstances: A student facing significant personal challenges (like a family crisis, a health issue, or a demanding job) may have both poor attendance and very little time or energy to study. In this case, the external stressor is the third variable causing both absenteeism and poor grades. The correlation is real, but the root cause lies outside the simple act of attending class.
D. Example in Economics & Business
- Field: Economics & Business
- Variables:
- Variable A: A company’s quarterly advertising budget (in dollars).
- Variable B: The company’s quarterly sales revenue (in dollars).
- Finding & Type of Correlation: In many industries, analysts find a positive correlation between advertising spend and sales. Companies that spend more on marketing campaigns often report higher sales figures for that period.
- Interpretation: For any business, this is a compelling correlation. It suggests that investing more money into advertising is a viable strategy for increasing revenue. Marketing departments lean on this data to justify their budgets and prove their value to executives.
- The Causation Trap: But does spending money on ads directly and independently cause sales to rise? This is where savvy business leaders need to be careful. Both third variables and directionality can cloud the picture.
- Third Variable (Market Conditions): A booming economy could be a powerful third variable. When consumers have more disposable income, they buy more of everything, leading to higher sales. At the same time, companies feeling optimistic about the economy might decide it’s a good time to increase their ad budgets. The strong economy could be driving both variables up independently.
- Third Variable (Product Hype): A highly anticipated new product launch (like a new smartphone or video game console) can create a massive surge in sales on its own. In response to this high demand, the company will likely increase its ad spend to capitalize on the momentum. Here, the product’s pre-existing popularity is the third variable causing both sales and ad spending to soar.
- Directionality: It’s also possible the relationship is reversed. If a company sees its sales are already trending upward for other reasons (e.g., a competitor goes out of business), it might take that extra revenue and decide to reinvest it into a larger advertising budget for the following quarter. Here, rising sales are causing the rise in ad spend, not the other way around.
FAQs
How do researchers know if a correlation is “strong” or “weak”?
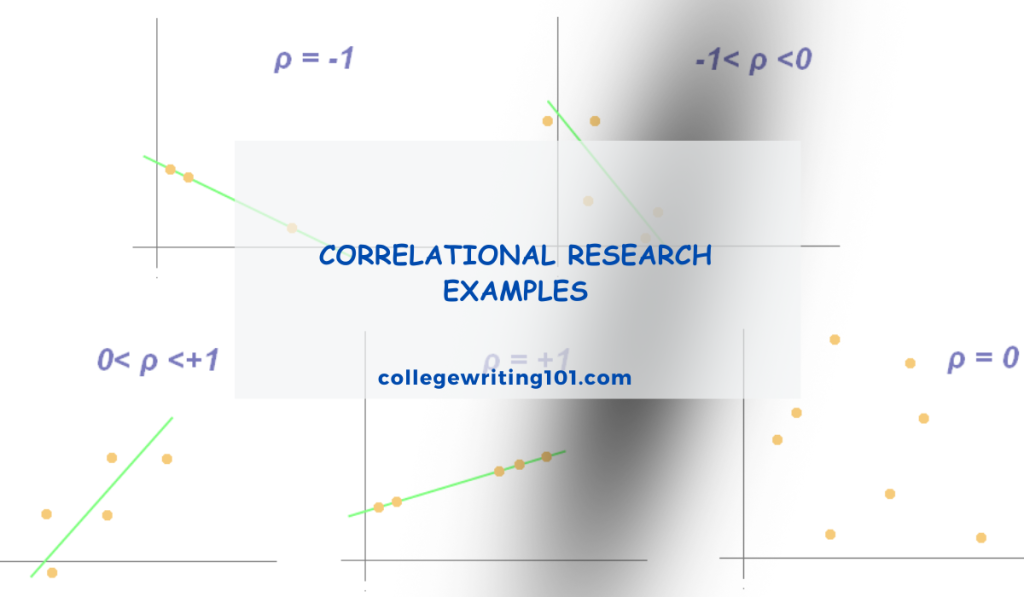
Researchers use a statistical measure called the correlation coefficient, most often represented by the letter r. This number ranges from -1.0 to +1.0 and tells you both the direction and the strength of the relationship.
A value of +1.0 is a perfect positive correlation.
A value of -1.0 is a perfect negative correlation.
A value of 0 means there is no correlation whatsoever.
The closer the number is to +1 or -1, the stronger the relationship. For example, a correlation of +0.8 (like between attendance and grades) is very strong. A correlation of -0.2 would be considered a very weak negative relationship.
If correlational studies can’t prove a cause, what type of research can?
To establish a cause-and-effect relationship, researchers must use experimental research. This is considered the “gold standard” because it’s a controlled process. In a simple experiment, researchers:
Create at least two groups: an experimental group (which receives the treatment or intervention) and a control group (which does not).
Manipulate one specific variable (e.g., they give the experimental group a new medication but give the control group a placebo).
Keep all other conditions exactly the same for both groups.
If the experimental group shows a different outcome than the control group, researchers can be much more confident that the one thing they changed—the manipulated variable—was the cause.
How can I spot flawed correlational claims in the news?
Being a critical consumer of information is a great skill. When you see a headline like “Study Finds Coffee Drinkers Live Longer,” here’s how to think like a researcher:
Look for Key Words: Headlines often use words like “linked to,” “associated with,” “related to,” or “predicts.” These are all clues that the study was likely correlational, not experimental.
Ask “What’s the Third Variable?”: In the coffee example, could there be a third factor? Perhaps people who drink coffee are more socially active (meeting friends for coffee) or work in office jobs that provide better health insurance. Their wealth or social habits might be the real reason for their longevity, not the coffee itself.
Consider the Direction: Could the relationship be reversed? (This is less likely in the coffee example, but always a good question to ask).
Check the Source: Is the claim coming from a sensationalized news report or a reputable scientific journal? Always try to find the original source to see how the researchers themselves describe their findings. They will almost always state the limitations of their correlational study directly.